DIGITAL PRESSURE & TEMPERATURE CHART RECORDER | PRESSURE DATALOGGER
Technical Support: Before contacting the technical support offices you should read the user manual that you received with your unit or you could download it here and try to understand the system on your own to get a better impression. If you have already tried and still you do not understand this system or you think that it is not working as it should work according to its design then you can contact our technical support.
1-2 hour software training available at Hydrorex offices where up to 3 people can attend for a low cost of: $400.00 bring your list of questions and doubts to help you solve them.
Why is my pressure fluctuating so much on the Digital Chart Recorder? There are several factors that cause this.
Understanding these factors will assist in completing the full picture of what is happening inside of your pressure system.
So what to do? Here are a few options:
The great thing about upgrading to Digital Chart Recorders is Transparency and Accuracy. The transition from Mechanical circle chart is fairly simple with understanding these factors.
The Accuracy of a standard mechanical Barton style Chart Recorder is typically +/- 1.0% Full Scale Accuracy. For example, if your Circle Chart recorder is rated at 1,000 PSI, a +/- 1% Accuracy means that the felt-tip pen is showing (and marking) the circle chart paper within an accuracy of +/- 10 PSI. When compared to a 1,000 PSI Digital Chart Recorder, which is 0.15% Full Scale Accuracy, this higher detail of accuracy will show you a reading of +/- 1.5 PSI – that’s about 6.5 TIMES More Accurate Reading than a Circle Chart.
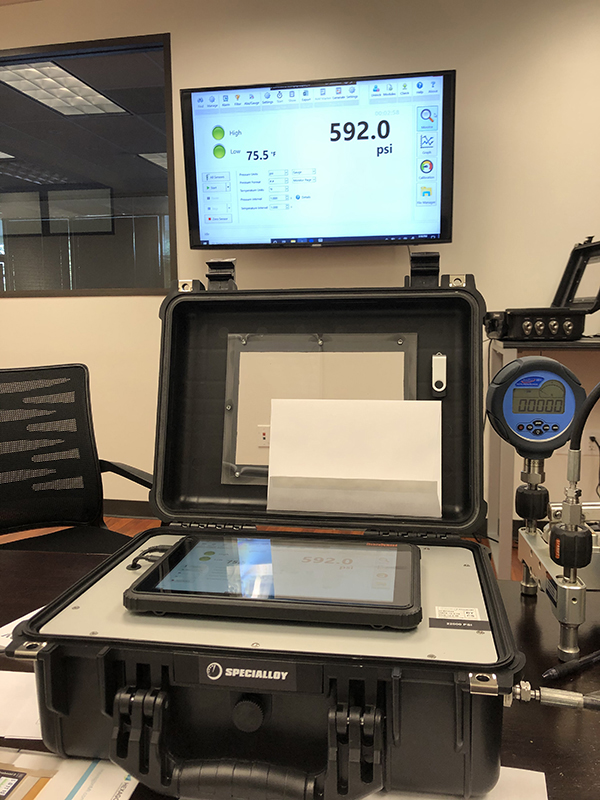
Secondly, the Transparency of a Digital Chart Recorder is easily seen on the screen display. Compare this to a Circle Chart Recorder which is marked by a Felt Tip Pen (which may or may not be New or Old, Bent or Straight, Dry or Too Wet, etc.) Additionally, standard Circle Chart Paper is displayed with 50 Lines — for this 1,000 PSI Recorder, each line displayed is 20 PSI Increments. Combining the possible inaccuracy or boldness of the Felt Tip Pen within those 20 PSI increments, it’s always up to the operator to determine the Current “Approximate” Pressure.
Understanding these factors will help to understand any fluctuations seen on the Digital Chart Recorder Display. With the same conditions (Internal Pressure/Temperature, Ambient Pressure/Temperature, etc.), both the Mechanical Circle Chart Recorder and also the Digital Chart Recorder would experience the same conditions. The only difference would be the display – a Mechanical Circle Chart Recorder tends to “hide” the accurate pressure rating (for reasons previously noted) while the Digital Chart Recorder simply shows what’s happening. While your Digital Chart Recorder might slightly bounce pressure display numbers up and down during stabilization time, these same physical conditions would also be happening to the Mechanical Circle Chart Recorder, however the Mechanical Circle Chart Recorder tends to “hide” these conditions.